The performance analysis text ranking system of CUAnalyzer is designed to give guidance to users about their performance while recognizing that credit unions have distinct strategies that may focus on alternative outcomes in addition to performance outcomes.
This feature includes two primary components:
- Textual analysis that includes ratio definitions and suggestions on how these relate in the context of the credit union.
- Star-based rating system to indicate a credit union’s relative performance for a given ratio
Note: When exporting packets to PowerPoint, the performance analysis text boxes are editable, so you are fully able to adjust the text as needed.
You can see how these parts display in CUAnalyzer in the below image:
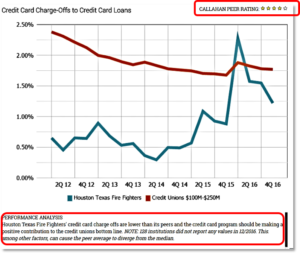
Textual Performance Analysis
In the definitions, you will notice these suggestions to indicate why a credit union might choose to handle decisions in a certain way.
For example, a credit union may choose to spend more on salary and benefits than their peers. Some might argue that in this case a lower ratio is better. However, an extremely low number could be indicative of an over-staffed organization, while a higher number could be a result of a very lean organization (fewer employees but higher compensation). Thus, for this ratio, it would be prudent to look at it the context of other operating data, specifically, the number of full-time equivalent employees.
Star-Rankings
For each metric, CUAnalyzer looks at the range of performance across the credit unions in your peer group comparison set. Star ratings are assigned base on the performance percentile as follows:
- 1 star = <10%
- 2 stars = 11-39%
- 3 stars = 40-60 %
- 4 stars = 61-89%
- 5 stars = 90+ %
The star-ranking system might seem to indicate that one credit union’s performance is better than another’s – and in many cases, that distinction can be made. However, for some ratios (ex. Net Worth) more stars just means that you are in a higher percentile for that ratio. In fact, some might argue that having too high a net worth ratio means a credit union isn’t investing enough back in the membership or the future.
A Word On Our Calculations
Another element to be aware of is the nature in which the performance ratings are generated. CUAnalyzer uses a percentile comparison calculation and ranks your credit union relative to the performance of the credit unions in the peer group – at the specified point in time. In general, this approach offers insightful takeaways and observations about the performance of the credit union. As the rating is generated based on a credit union’s performance in the most recent quarter, one should also evaluate historical trends to understand true performance.
While we realize that this is not a perfect system, we feel that this is the best method for generating the most accurate ratings for the majority of credit unions in the country.
[zilla_button url=”/support/wp-content/uploads/2016/06/Explanation-Performance-Analysis-Text.pdf” style=”blue” size=”medium” type=”square” target=”_blank”] Download/View PDF [/zilla_button]