Measuring Member Value
Credit unions have different goals than for-profit financial institutions. Instead of solely examining financial data, credit unions must also quantify the value they provide to members to accurately understand their performance.
Callahan’s Return of the Member score is built just for that. Return of the Member, also referred to as ROM, looks at the value a member derives from being a member of your credit union.
In this article, we provide:
- An in-depth explanation of the metric itself, as well as its underlying components
- How to set up analysis of ROM in Peer-to-Peer
- How to see your ROM ranking
Callahan & Associates created a holistic scoring system that looks beyond the safety and soundness issues that are covered in NCUA’s CAMEL scoring. We use the 5300 Call Report for this and ultimately look at the three main areas of credit union operations, which are: return to savers, return to borrowers, and member service usage.
Credit unions serve over 108 million members. That’s more than 30% of the U.S. population. As credit unions continue to grow in membership and gain in popularity as an alternative to for-profit financial services providers, they need a way to demonstrate the tangible benefits of credit union ownership.
In 1996, Callahan & Associates developed the ROM scoring that uses data from the 5300 Call Report to provide an assessment of member value.
Frequently Asked ROM Questions
How Is ROM Calculated?
- For each of the 18 metrics in ROM, the Peer-to-Peer software ranks your performance to your peers.
- The primary credit union’s final score is a combination of the weighted average of the percentile ranking for each ratio.
- All of the weighted metrics are added together within each category to get a total sub-score and percentile ranking.
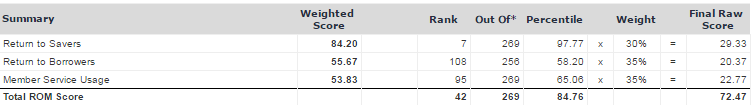
- The 3 category sub-scores are then put into the summary table, where they are weighted and summed to get the final ROM score.
- Credit unions with a percentile ranking of 100% are considered leaders in providing services to their members.
What Does My Raw Score Mean?
- The raw score represents a Credit Union’s weighted score for ROM.
- This raw score is then translated into a ranking and a percentile ranking versus all other peer credit unions.
Original Vs Current ROM Score?
- In 2013, we tweaked some of the weightings and formulas to reflect the lower rate environment.
- We recommend looking at the default, newer model.
- If you look at original ROM model, you will see the older version, and, if you look at Return of the Member Index main folder, you will see calculations which better reflect the current industry environment.
Using ROM In Peer-to-Peer
Before you jump into using ROM in Peer-to-Peer, you need to set up your analysis properly in order to make your analysis meaningful.
We’ve got you covered:
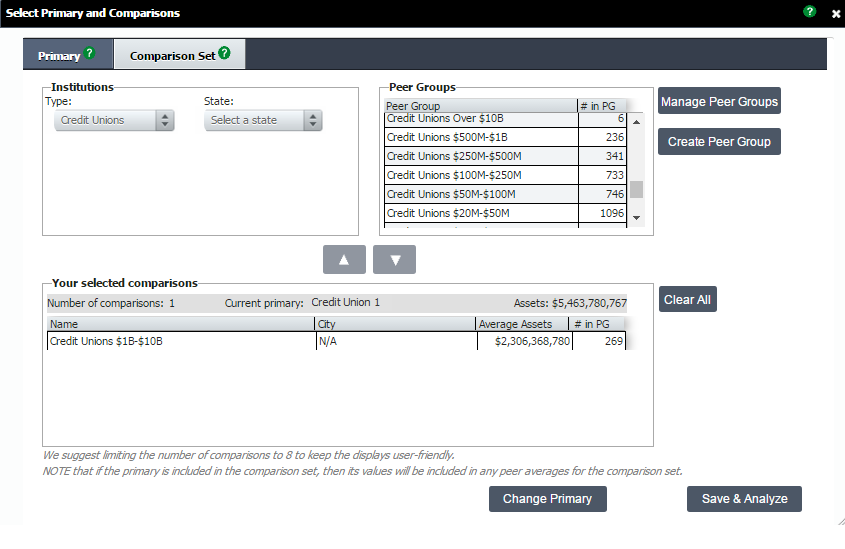
To properly use the ROM scoring system, the first step is to make sure you have your analysis properly set up with an individual institution as your primary, and an asset-based peer group as your comparison set.
Asset-based peer groups are already built-in and ready for you to use. While you may use a custom peer group, we recommend getting started with one of our pre-built groups.
ROM generates scores based on benchmarks, and therefore, will not work if you do not have a peer group in your comparison set.
There are two built-in ROM report ready and waiting for you in Peer-to-Peer.
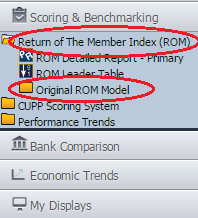
If you navigate to Scoring & Benchmarking on the left hand navigation, and click on Return of the Member Index, you will see two analyses, described in full below (Click to Jump):
1. ROM Detailed Report for Your Primary
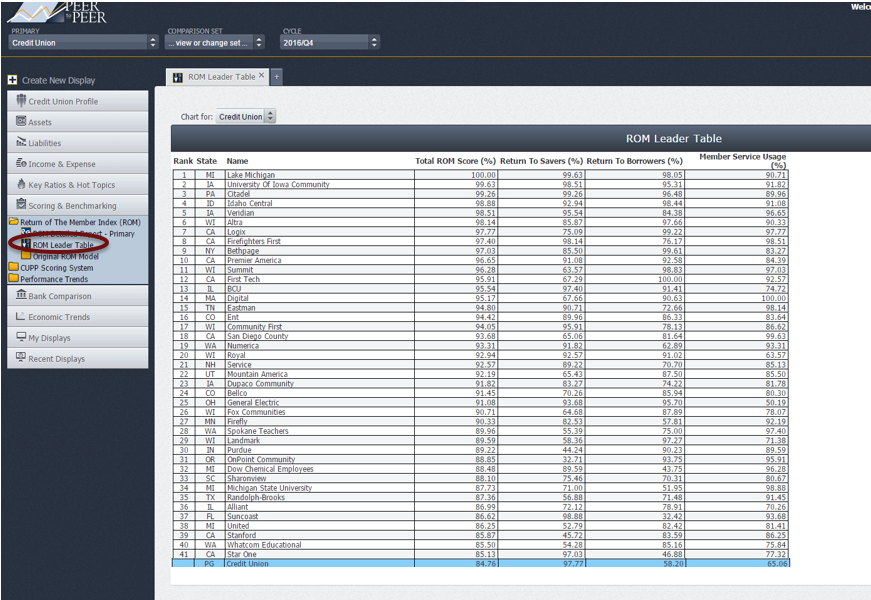
2. ROM Leader Table
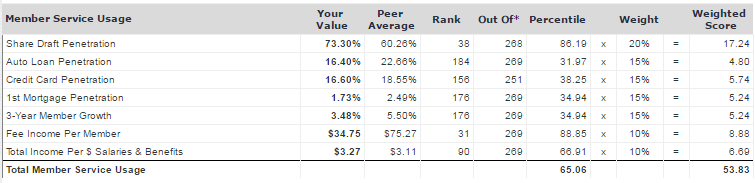
Example: ROM Scoring Display
ROM Component Details:
Return to Savers
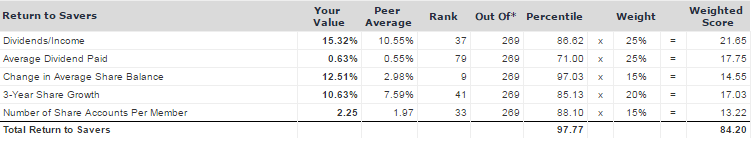
The first component of the Return of the Member scoring system is Return to Savers.
It measures how well a credit union is providing deposit services to its members.
In addition to measuring dividends to income, this component also takes into account average dividend paid, change in average share balance, three-year share growth of the credit union and the number of share accounts per member.
Return to Borrowers
The lending component Return to Borrowers, recognizes that credit unions were created to provide credit to their members at a reasonable cost.
The index rewards those credit unions that offer a lower rate on loans, but it also considers the historical growth in lending and the variety of products offered to its members. .
In recent years, credit unions have started to sell more loans to the secondary market. To accommodate credit unions becoming more involved in the secondary market, Callahan & Associates has added the loan servicing portfolio as a component of the score.
Return to borrowers also looks at:
- Yield on average loans
- Loans per member
- 3-year loan growth
- Year-to-date loan originations per member
- Change in average consumer and real estate loan balance
Member Service Usage
The final component is Member Service Usage. This component measures how efficiently a credit union provides and promotes services to its members.
The leaders in this category are those credit unions that have a high number of core account relationships with their members.
The penetration rates are a key metric as to how members value the credit union’s product offerings. Do members consider the credit union their primary financial institution (PFI) or are they looking elsewhere for their other financial needs? Moreover, measuring productivity of employees by calculating the amount of revenue generated per dollar of salary and benefit expense helps to capture the staff involvement in member activity.
There is a positive correlation between member activity and the amount of income generated per employee as credit unions with a more active membership base are more likely to use the credit union as their PFI and generate more revenue. Attractive rates and products attract new members.
Example: ROM Leader Table
For additional ROM resources, check out the Callahan Ideas In Action hub for Measuring Member Value: