What is CUPP?
The CUPP Scoring System, also known as the Credit Union Performance Profile, was developed by Callahan & Associates to quantify key areas of asset quality, capital adequacy, earnings and operating efficiency, and liquidity.
CUPP was designed to mirror CAMEL, NCUA’s rating system which was created in 1978 as a means to provide an accurate and consistent assessment of credit unions financial conditions and operations.
The CAMEL scoring system is broken down into capital adequacy, asset quality, management, earnings, and liquidity, and serves as a fundamental component of your annual NCUA examination. CUPP measures all of those components, except for management, which can not be quantified using 5300 data. Due to ease of use and the dynamic nature, CUPP a great alternative to CAMEL for determining whether you are prepared for an examination.
CUPP is made up 20 ratios – 5 for each category. The ratios are weighted and the results are ranked on a 1 to 5 scale. 1 being the best, and 5 being the worst. These scores are weighted and summed to get an overall CUPP Score. CUPP is a great tool for preparing for NCUA examinations, as well as assessing your credit union’s overall financial health.
How to Set Up Your CUPP Analysis
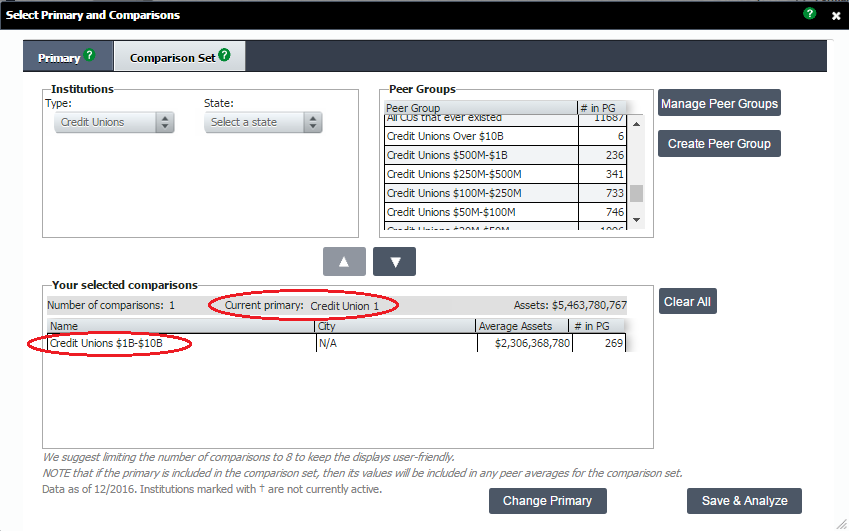
When using CUPP, make sure your analysis is properly set up with:
- An individual institution as your primary point for analysis and
- An asset-based peer group as your comparison set
Since CUPP is meant to mirror the NCUA Camel scoring system, be sure to select an asset-based peer groups from the comparison set. This will guarantee a more accurate analysis.
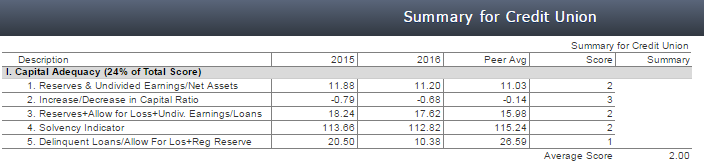
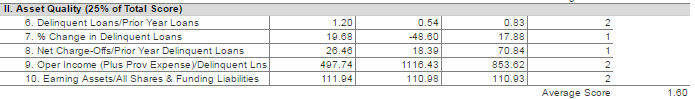
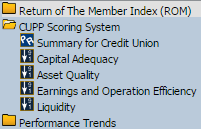
Display Type 1: Summary For Credit Union Display
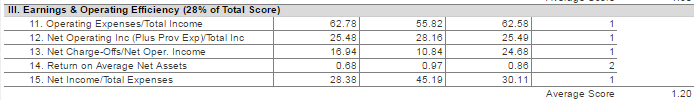
There are four sections that make up the CUPP scoring system within the “Summary for Credit Union” display. Under each of the four sections, there are five ratios that are used to calculate the corresponding section.
As shown in the below screen grabs, the current and previous year values, the peer average, and the score for your primary institution are in each row. Each section has its own sub-score, which feed into the total CUPP score are at the very bottom of the display.
Open your CUPP score, by clicking here.
Display Type 2: Key Financial Ratios
There is a built-in display for each of the four categories within the CUPP Scoring System folder:
- Asset quality;
- Capital adequacy;
- Earnings and operation efficiency;
- Liquidity.
You can view each display to see your credit union along with all of the institutions that make up the comparison set. The overall score, the different ratios, and the ranks are also included.
Here, you will see your credit union highlighted in blue and your comparison set average highlighted in orange. The set up is the same for each of the four categories.
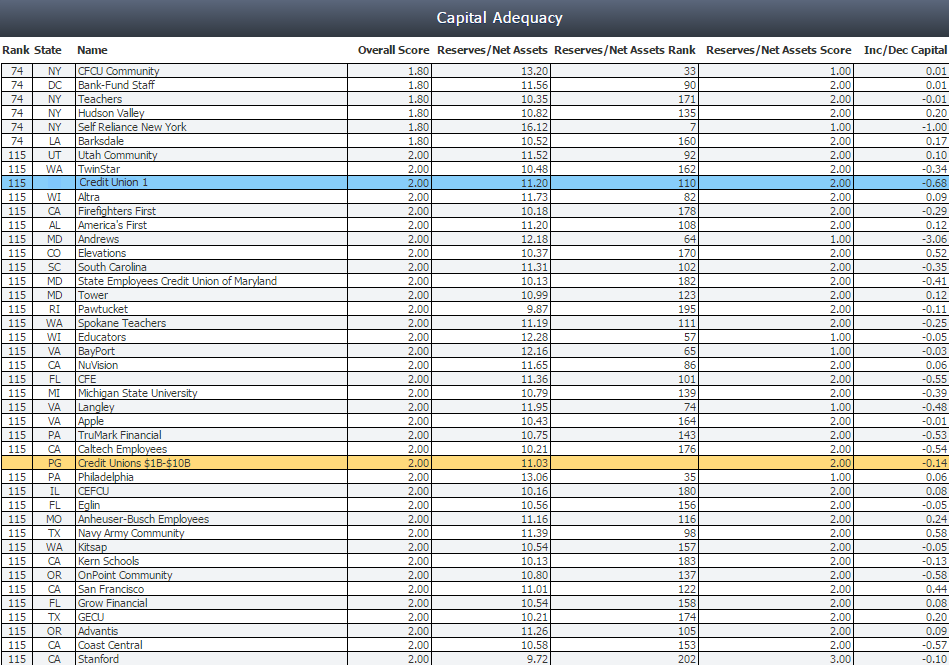
By default, displays are sorted by overall score. You can re-sort them by clicking on any of the column headers, which is useful to identify top performers for specific formulas within the selected CUPP category.