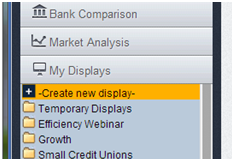
While Peer-to-Peer includes hundreds of built-in charts and graphs, you may find the need to create your own charts and graphs using formulas and any accounts code you would like. Peer-to-Peer makes this easy for you to do this under the ‘My Displays’ section located in the bottom left of the program.
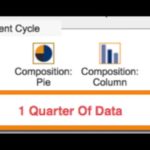
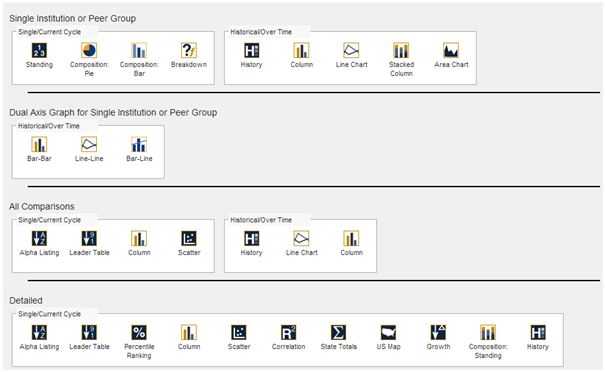
To create a new display click ‘Create new display’ at the top of your ‘My Displays’ section. Choose the type of graph/chart/list you would like to create.
Once you have selected your display type, the formula page will pop up for you to populate. Start by giving your display a title at the top. Make sure that title is something that you will remember and that a display does not already exist with that title.
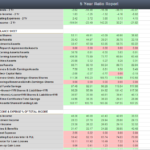
Under the formula box, type in any account code or formula in the blank space. If you know the account code, make sure to put the letter ‘a’ in front of the code so that Peer-to-Peer can recognize that this is an account code.
For example, if you are trying to pull the Cash on Hand at the credit union, you would be using account code 730A. To enter this in the formula section, you would write a730A. If you are entering a bank account code, do the same thing except use the letter B at the beginning instead.
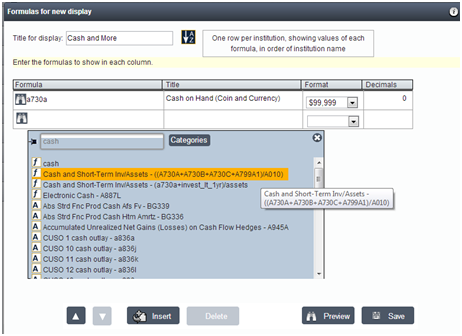
If you are not that familiar with the call report, you can use the binoculars to search for formulas or account codes as shown in the above image.
For more information on formulas, visit the formula page here.
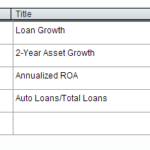
Add a title to the formula if it does not populate for you. This will show as a header on data displays and on the x-axis for charts/graphs.
The format should default properly for you. If you need to change the format (ie. from currency to percentage), you can do this here. You can also choose the number of decimals you would like Peer-to-Peer to pull for you. Type 0 if you do not wish to have any decimals places show.
If you click on the outside of the box once you have completed the first row, a second row will automatically appear for you. You can also insert another row by clicking ‘Insert’ at the bottom. Click ‘Preview’ to preview the display or click ‘Save’ to save the display in a folder. You will be prompted to then select the folder you would like the display to be saved. To save the display in a new folder that does not already exist, scroll down and click ‘New Folder’ at the bottom. Name that folder and click ‘Ok’.
In the future, the display can be found in the folder where you saved it under your ‘My Displays’ section.