How-To Videos Peer-To-Peer Using & Modifying Displays

P2P Tutorial: How To Use Chart Options (103)

Peer-to-Peer has default settings to graphically present displays, learn how you can change these settings based on your preferences or desired objectives.

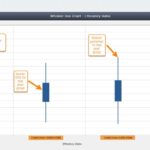
Peer-to-Peer allows you to tailor your displays to make your analysis more meaningful. In this five part series you will learn:

  1. How to change chart types;
  2. How to change start and end dates;
  3. How to change chart frequency;
  4. How to change data labels.

Related Content

  • P2P Tutorial: How To Use The 5300 Call Report

    Callahan & Associate’s Peer-to-Peer financial benchmarking software drives off of data from the NCUA 5300 Call Report. Watch this series to learn how to navigate through the 5300 and customize...
  • WCMS Support

    WCMS Webinar Guide Document – 2017
  • P2P: How To Create Whisker Box Chart

    A Whisker Box Chart is a graphical display that shows the percentile distribution of two or more peer groups. This display shows top performers, bottom performers, and where the middle...
  • P2P: Updating Role and Vendor Data

    Credit unions have the opportunity to role and vendor data associated with their credit unions directly in Peer-to-Peer.