Are you using a large peer group and worried that large outliers will skew the average? Luckily, Callahan & Associates has added the ability to look at different types of peer group values. By adjusting peer group values, you now have the option to look at the median, top 10%, top quartile, lowest 10%, and lowest quartile.
Peer Group Values can be used to help analysis with:
Have credit unions in your state merged? Their growth metrics will skew the weighted averages dramatically, so use median instead.
Tired of being mediocre? We thought so too! Benchmark your performance off the top 25% (or be really ambitious and go for the top 10%)!
Where can you find Peer Group Values?
Peer Group Values can be found under chart options, either on the left or right side depending on the display type.

Understanding Peer Group Values
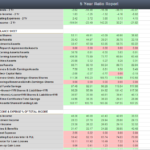
The example below illustrates the differences between medians and averages when looking at ROA. The table on left show the weighted averages, on the right medians. As you can see, the median value is considerably less for ‘All Credit Unions in U.S.’, due to the varying asset sizes of credit unions across the country.


Peer-to-Peer by default will use weighted averages to calculate an average for a peer group. Weighted averages give larger numbers more influence in the calculation. Alternatively, the median will show the middle number for the peer groups, which is higher in some cases, lower in others, and the same result in the rest. Medians can be helpful to understand, and account for, metrics with a wide distribution of values. Comparing the median to the weighted average ROA is beneficial in illustrating how ROA is distributed among the credit unions in the peer group.
The example below highlights the differences between top 10% and average asset growth when comparing a credit union against a group of peers looking. The top 10% trendline has a considerably higher asset growth rate than the peer group average; this can be beneficial in understanding characteristics of high performing institutions as well as aspirational goal setting.


Delinquency, where lower is better, is an example where using the lowest 10% peer group value option can add insight to your analysis. As seen below, the average for All Credit Unions is much higher, and when compared against the lowest 10%, you are able to see where opportunities may exist to improve performance.