The ROM percentile score is a great indicator for how well a credit union serves its members compared to its peers. Some credit unions use this score to track their success in returning value to their members and setting performance bonuses for employees.
It is important to note that the ROM percentile will change over time for several reasons. Besides credit union performance, ROM percentiles might change because the peer group has changed. For example, there were 246 credit unions between $500 million and $1 billion in 1Q 2017, and 251 credit unions in that asset range as of 1Q 2018. This difference in peer group will cause the ROM percentile to change between the years as institutions with difference performance move in and out of the peer group.
You can now review ROM percentiles historically within Peer-to-Peer by following these steps:
- Set an institution as the primary
- Add the asset-based peer group to the comparison set. ROM is a comparative score, so you must have your asset-based peer group selected to generate a calculation
- Navigate to “Create New Display” and create a historical display for your primary
- If you need help creating a new display, check out this page for step by step instructions
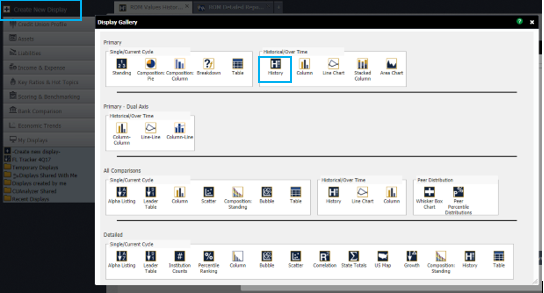
- If you need help creating a new display, check out this page for step by step instructions
- To see each percentile, paste or type the following formulas in the formula bar*:
- “SavedROM” will show your historical Return of Members value
- “SavedROS” will show your historical Return of Savers value
- “SavedROB” will show your historical Return of Borrowers value
- “SavedMSU” will show your historical Member Service Usage value
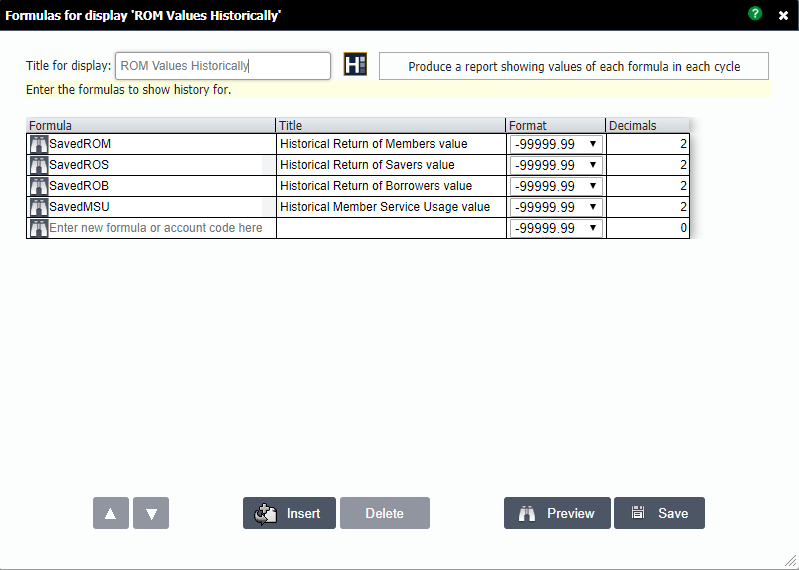
*Formulas are not case sensitive